jimfeng/E+ via Getty Images
The Importance Of The Housing Market
With house prices having increased in value by over 20% this past year, there is now mounting evidence to suggest this trend in housing appreciation is not only set to stall, but may indeed roll over in the year ahead. Understanding the cyclical and structural standing of the US housing market is a critical component of assessing the business cycle, as any move lower in housing will have critical implications for the economy.
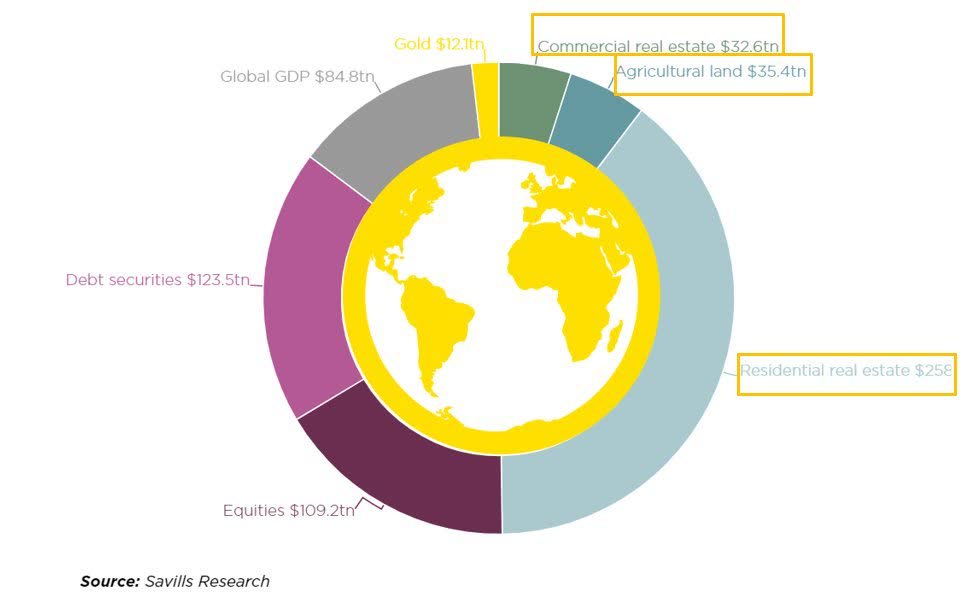
According to the National Association of Homebuilders, the activity in housing through the mechanisms of residential investments and housing-related consumption spending contributes to around 15-18% of GDP. As such, real estate cycles should be monitored with in-depth consideration as housing is one of the most cyclical parts of the economy and thus one of the major cyclical drivers of economic growth and consumer welfare. After all, real estate is the biggest asset class on the planet.
Source: Macro Alf
Due to housing’s sensitivity to interest rates and the close associated of housing and construction, a downturn in housing activity and housing-related spending is a warning sign that the tailwind to the economy that has been the US housing market of late may now be turning into a headwind.
Analysing the housing market through the lens of demand and supply, mortgage rates, consumer balance sheets and demographics allows us to assess the outlook for US housing from both a cyclical and structural perspective, whilst providing an important insight into where the growth cycle is headed. As it stands, waning demand, rising mortgage rates and temporary increases in supply are all providing a clear cyclical headwind in the housing market that should push prices lower in the coming months, whilst the structural outlook for the housing market remains on solid footing thus providing some comfort that any pull-back in house prices will not be akin to 2008.
Housing Market Set To Stall
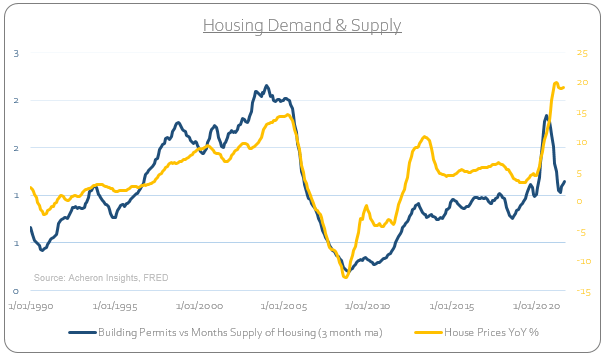
Starting with housing demand, one of the most reliable longer-leading indicators of both housing activity and economic growth as a whole is building permits. Following the highest year-over-year spike in growth in April of 2021, building permits have been trending lower over the past 12 months.
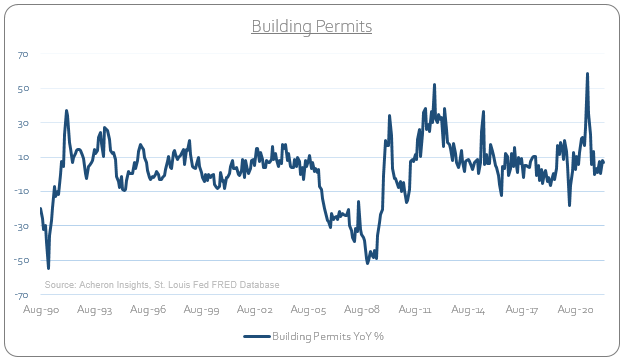
Given how building permits precede housing construction and are impacted by cyclical factors such as mortgage rates, the trend in permits provides important insight into the direction of housing growth and thus housing construction. This trend lower is clearly indicative of waning demand.
With both 15-year and 30-year fixed mortgage rates hitting their highest levels in over a decade (4.38% and 5.11% respectively) and thus crowding out potential buyers, it is hardly surprising to see demand rolling over. Although much of the outstanding mortgage in the US is fixed in nature, potential home buyers are not afforded this luxury and are subject to these higher mortgage rates.
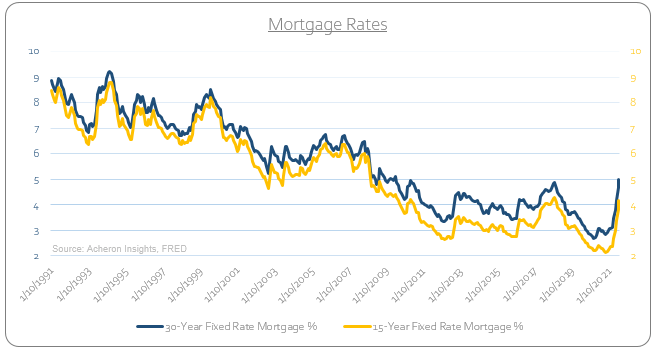
Therefore, it is hardly surprising that both the level and direction of mortgage rates provides a lead on house prices, given they represent the cost of borrowing. After all, this has been the quickest rise in mortgage rate since 1994.
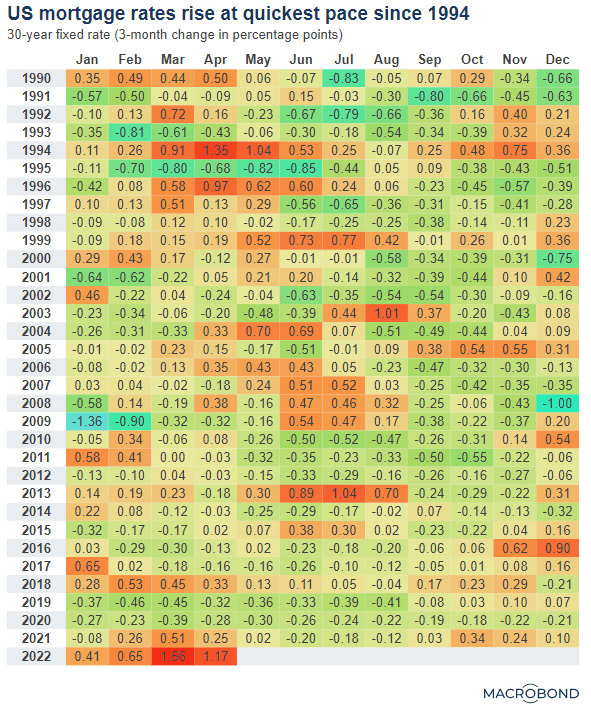
Source: Macrobond
As borrowing costs rise, we see a drag on demand which leads to a fall in mortgage applications and a headwind for house prices. As I have noted, whilst existing home owners are less impacted by this dynamic, any potential new home buyer is now subject to paying the highest mortgage rates in over a decade should they wish to purchases a home at a time whereby house prices are the most expensive they have ever been.
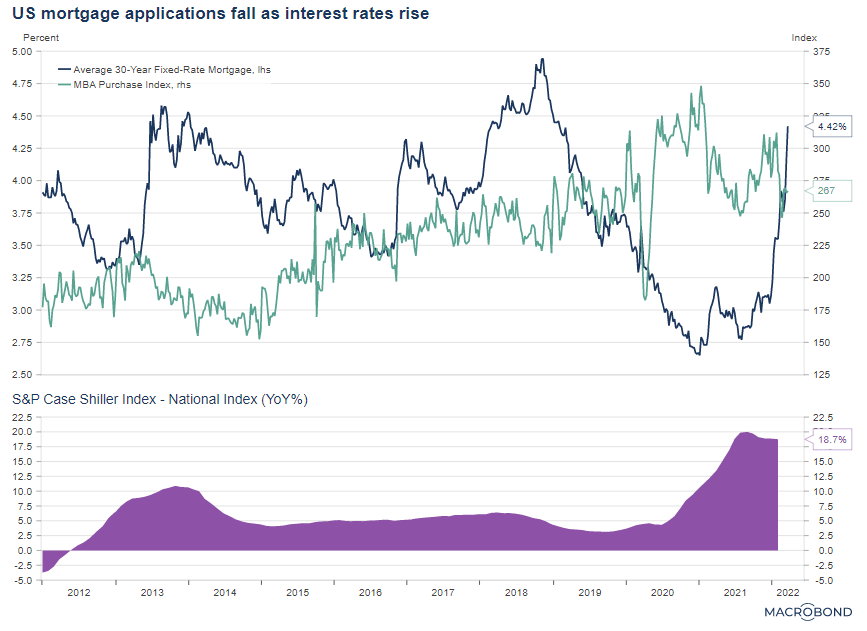
Source: Macrobond
As such, real mortgage rates in particular tend to provide a long lead for house prices and are telling us the market have become overextended.
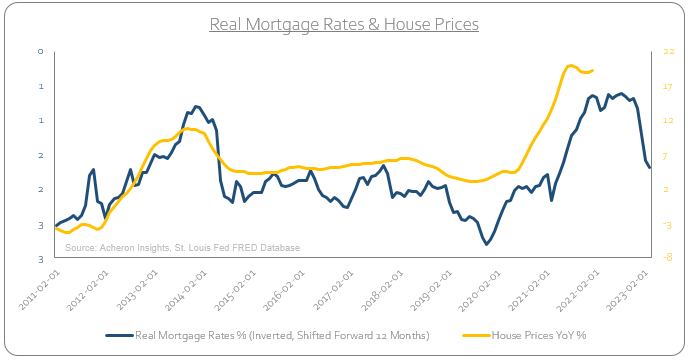
Mortgage rates have a long history in impacting housing affordability and house prices. So long as mortgage rates continue to trend higher and remain elevated, house prices will struggle to move significantly higher in the near term as demand falters. As the chart by Macrobond below illustrates, higher mortgage rates equal less affordable housing.
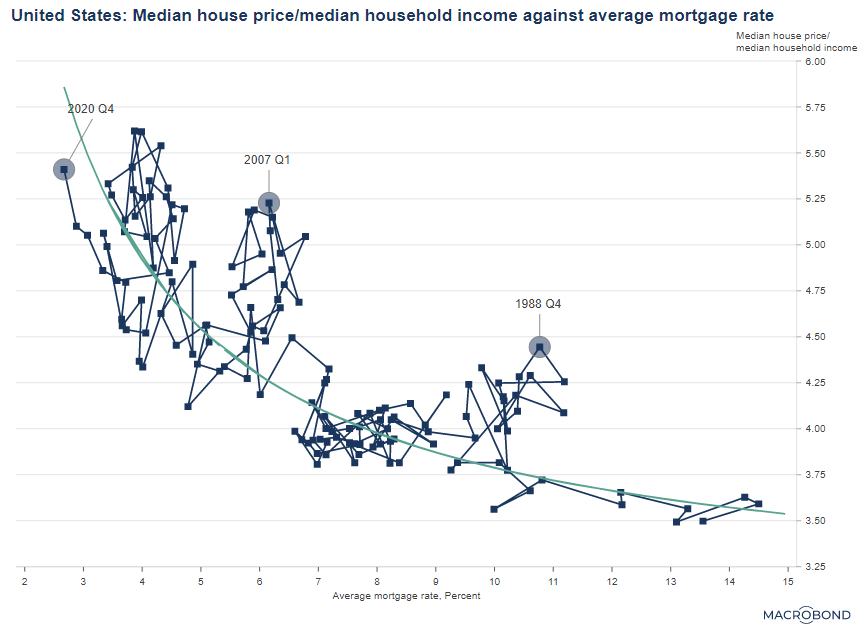
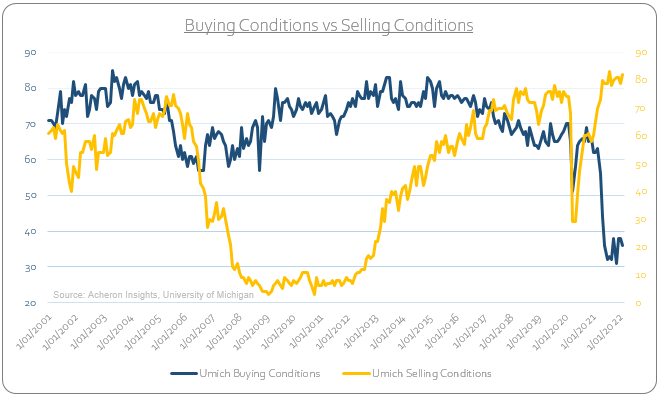
With housing affordability where it stands today, the spread between consumers intentions to buy a home and consumer’s intentions to sell a home per the University of Michigan is at its widest in a decade. Indeed, buying intentions for housing have not been this low for over 20 years, whilst intentions to sell remain elevated. We are clearly amidst a sellers’ market, and, when there are more sellers than buyers, prices move down accordingly.
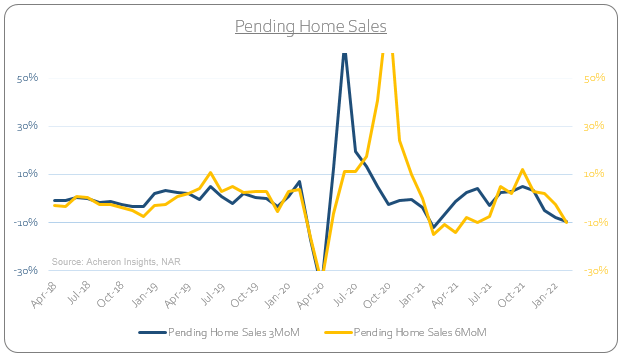
On a shorter-term, we can see these trends beginning to show up via home sales, and more importantly, pending home sales. Pending home sales measures the contract activity in housing, and, because sales generally go under contract a few months prior to the actual sale, pending home sales provides us with a short lead on actual home sales. As we can see below, pending home sales have been trending lower on both a quarterly and six-monthly growth rate basis since the latter stages of 2021.
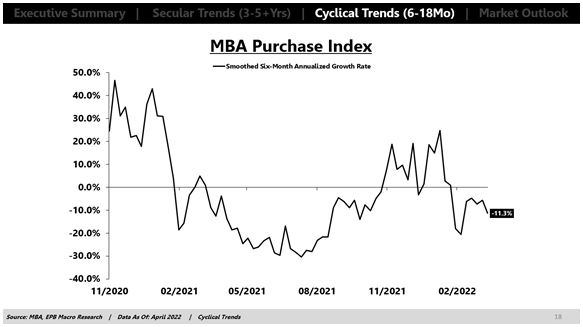
Indeed, also confirming these trends in demand is the MBA Mortgage Purchase Index, which too has been trending lower through the turn of the year as mortgage rates have soared. As mentioned, mortgage applications activity tends to provide some insight into the direction of house prices as they impact both building permits and home sales. Clearly, demand for housing is waning.
Source: EPB Macro Research
Interestingly, the yield curve has also historically been a leading indicator for building permits by around 12-18 months. Despite what you think of the yield curve predictive capabilities for the economy, this largely aligns with my own forward outlook for growth.
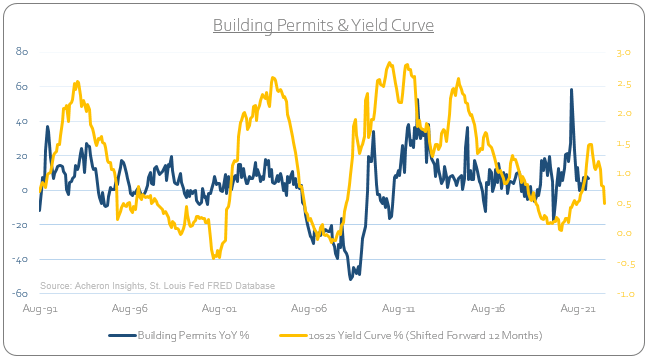
This has important implications for housing construction. Given how construction within the housing sector provides a significant cyclical boost to the economy (as I will delve into later), waning demand will continue to flow through to construction activity.
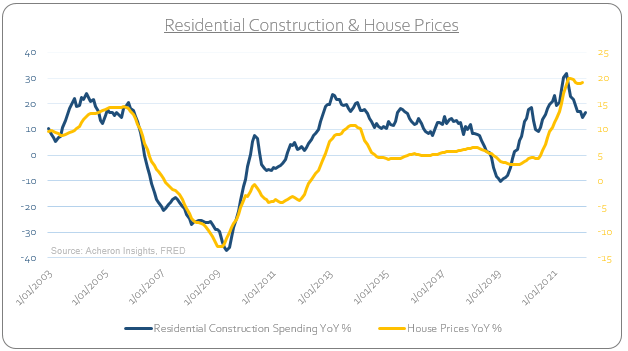
Indeed, as we can see below, the trend in residential construction has rolled over and is another indicator suggesting house prices have peaked for now.
What is also concerning for prices from a cyclical perspective is how housing supply has rebounded over the past 12 months. Though there still remains a structural undersupply of housing, we have seen the biggest year-over-year increase in supply in some time and are now at the average level of months’ supply of housing seen over the past decade.
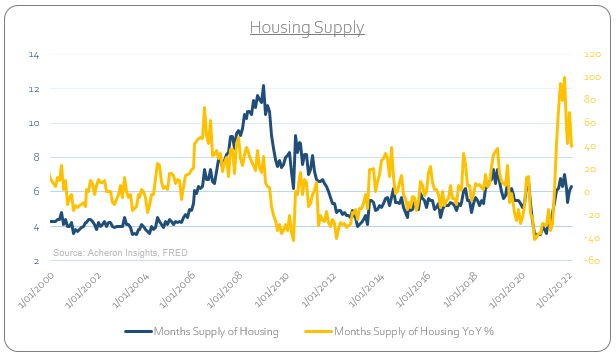
Such a rise in supply becomes problematic for house prices when met with falling demand, of which the data suggests is clearly evident as I have discussed. This demand and supply dynamic has now become a short-term headwind for house prices and too suggests a pull-back is on the cards.
Implications Of A Stall In House Prices
Given the dynamics in housing demand, supply and mortgage rates I have discussed, not only are the implications evident for housing prices themselves over the ensuing months, but these dynamics will also have significant implications for both the economic growth and the performance of housing related homebuilder stocks.
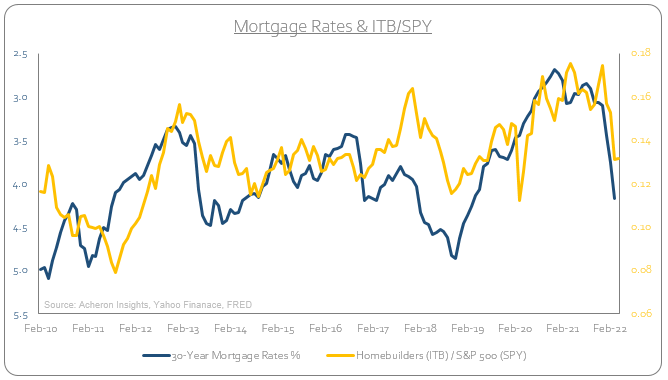
Indeed, higher mortgage rates are still pointing to ongoing underperformance for homebuilders (per the ITB ETF) relative to the stock market.
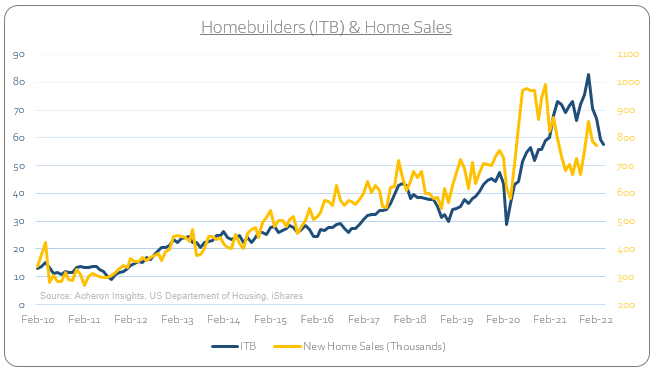
Whilst home sales are not supportive of any move higher in homebuilder stocks any time soon.
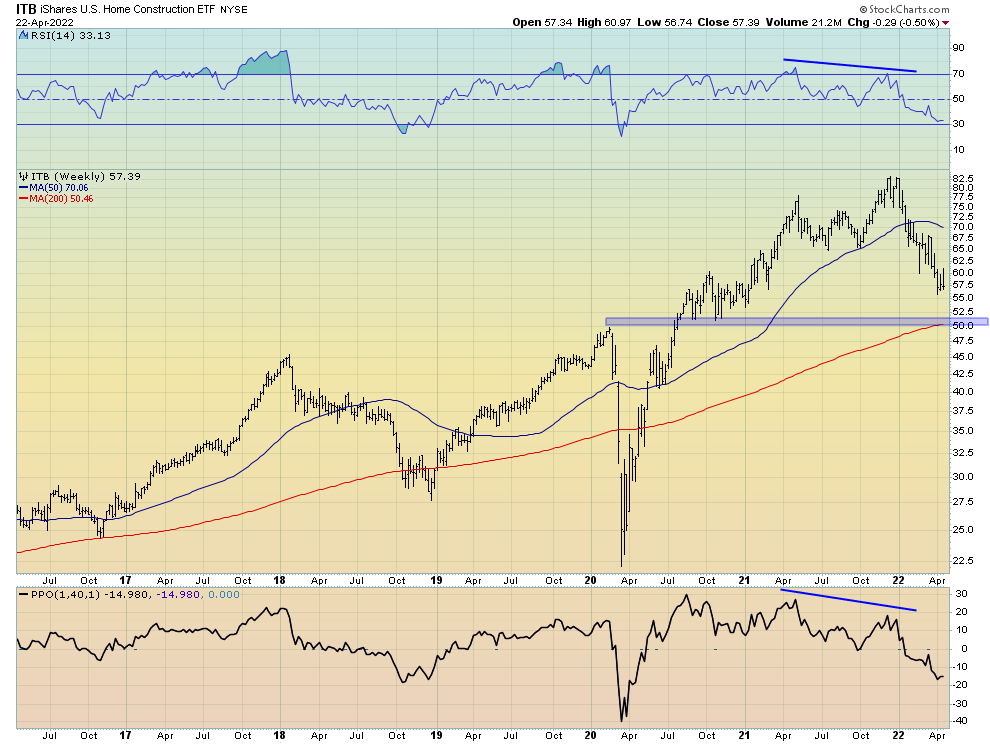
From a purely technical perspective, homebuilders look vulnerable. Given the outlook for housing and the macro backdrop, I struggle to see any reasons why we do not at least test the $50 support level at some point this year. It is worth noting however that homebuilders do look somewhat oversold on the shorter-term charts, and could to with a bounce in the coming weeks.
I suspect any relief rally to be short-lived, however. Indeed, as noted recently by SentimenTrader, “when homebuilders underperform equity markets to a significant degree, this has historically not bode well for both the future performance of homebuilders and broad equities going forward.”
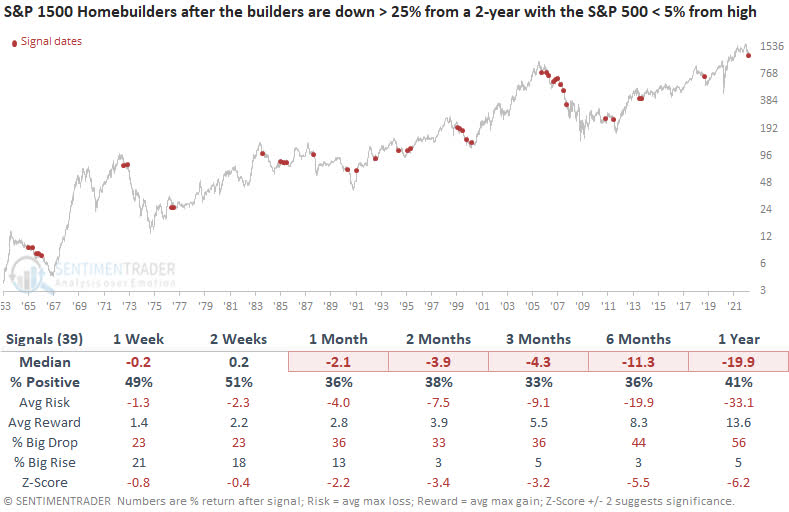
Source: SentimenTrader
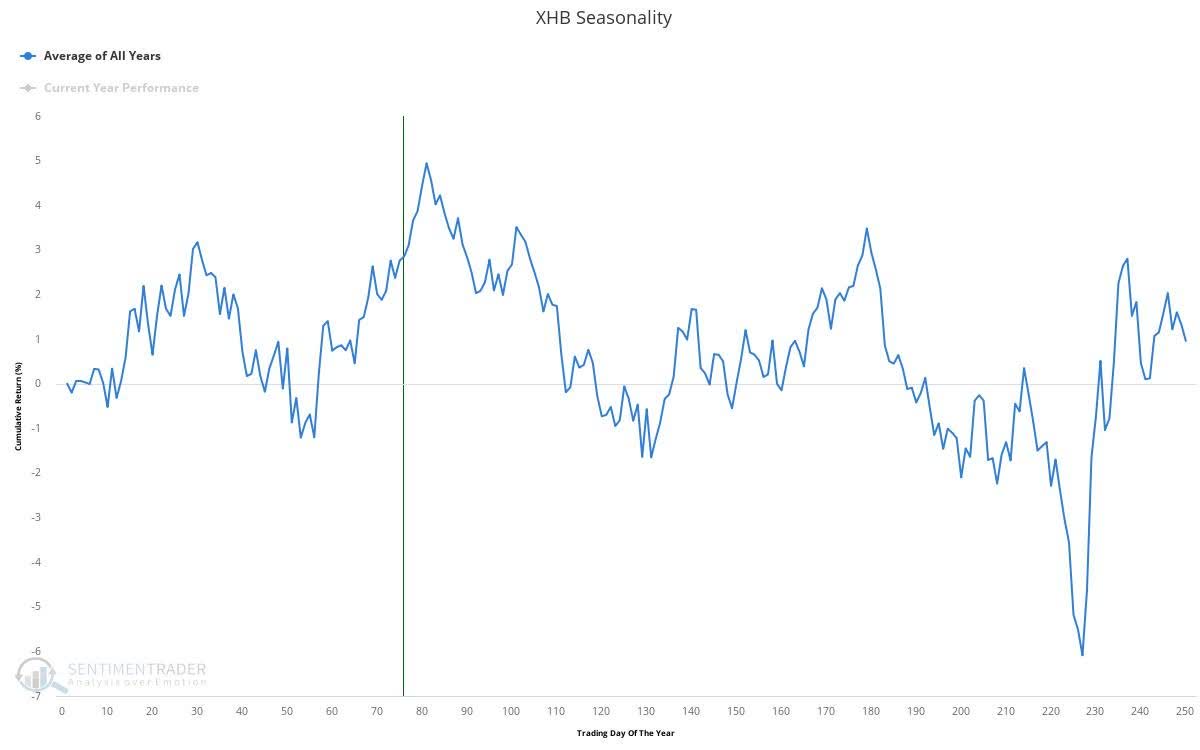
We are also entering a seasonally unfavourable period for homebuilder stocks.
This is important to note given housing’s importance to the economy. If homebuilders continue their relative underperformance, it suggests the stocks/bonds ratio is headed lower (which would most likely be through stocks falling further than bonds).
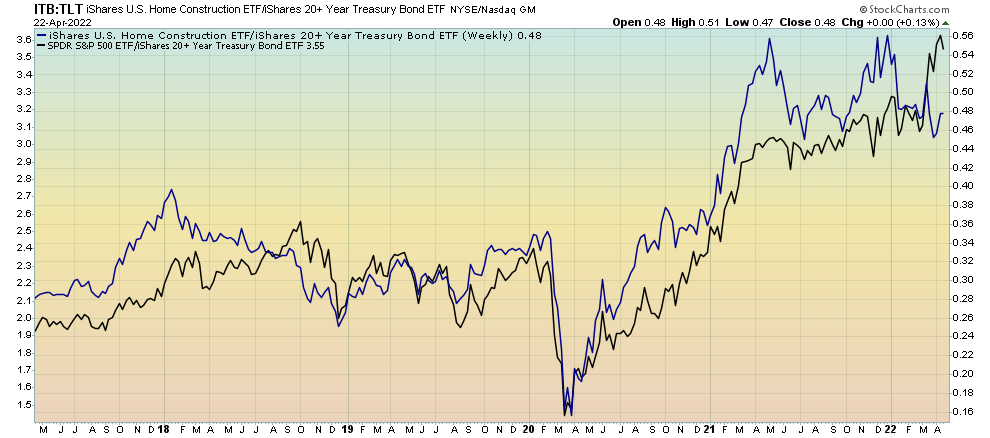
Observing these market internals and their movements are incredibly valuable tools as they provide an insight not only to the prospects for asset markets, but for the economy as a whole. The great Stan Druckenmiller himself has discussed how the best economic predictor he has seen are the relative performance of the cyclical sectors within the stock market.
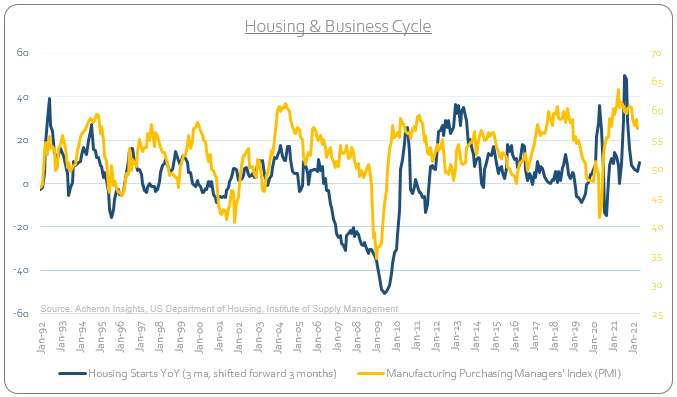
Homebuilders are certainly echoing this notion given how important housing is to the business cycle. Economic growth and construction are tightly linked, and the trends in housing will give us an indicator of the trends in construction. We can see this relationship below as housing starts tend to lead the growth cycle, as proxied here by the ISM manufacturing PMI. Housing starts are clearly suggestive of slowing growth.
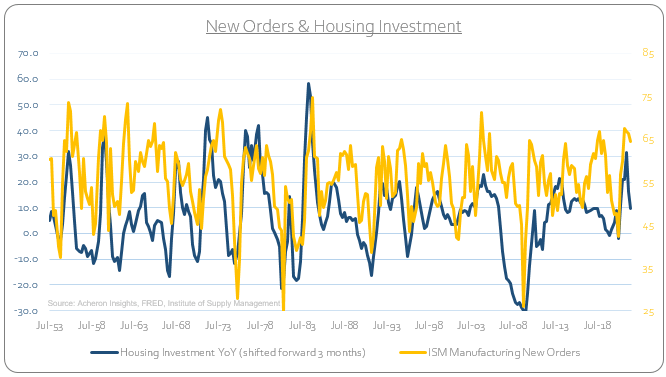
A similar relationship can be seen with housing investment and ISM manufacturing new orders, which too is suggesting slower growth and a sub-50 PMI.
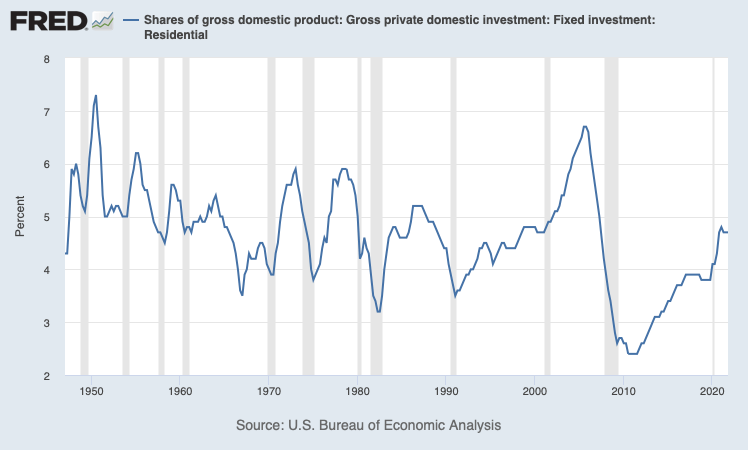
So too is the relationship of residential fixed investments as a percentage of total fixed private investment, one of the more reliable long-term leading indicators of the growth cycle. A slowing housing market is and will continue to be a drag on growth for the time being. Clear are the cyclical implications of the housing market.
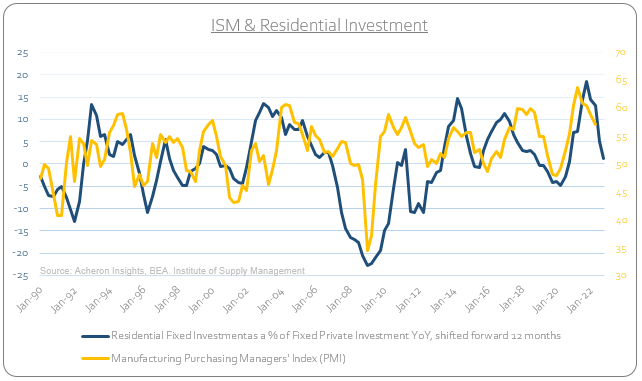
In almost every business cycle in the past 70 years, housing-related investment generally starts to decline as a percentage of total GDP in advance of major economic downturns. When housing starts to decline as a percentage of overall GDP, the economy losses a cyclical tailwind.
We can perhaps find some solace in the fact that residential fixed investment as a percentage of GDP has yet to materially move lower in such a manner that has preceded past recessions, though as I have indicated this is likely to occur in the months ahead, and, depending on how material a decline is seen should help us assess the severity of the economic slowdown.
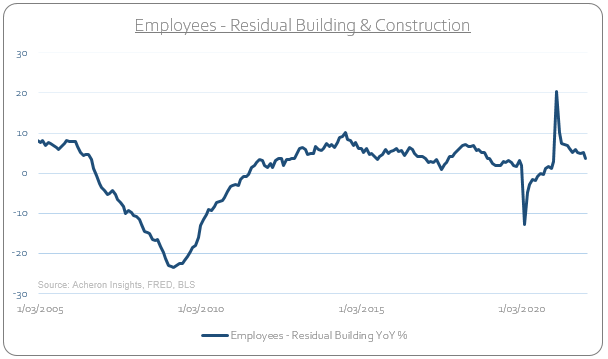
For now, a slowing housing market will negatively impact employment in the residential building and construction sector. Though employment is very much a lagging economic indicator, the timeliness of employment as an indicator can be enhanced by looking at the trends in the more cyclical components of employment, such as residential construction. Residential building and construction-related employment is trending lower.
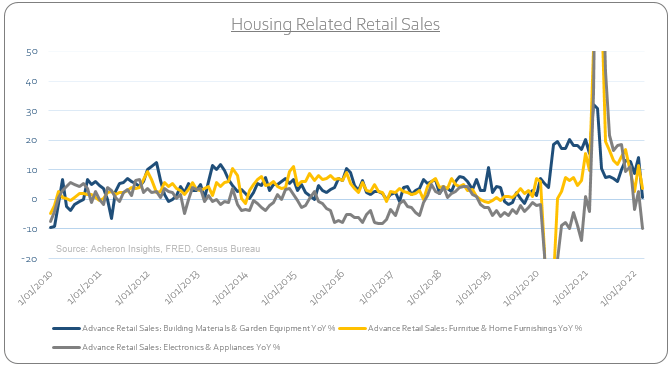
As are housing-related retail sales.
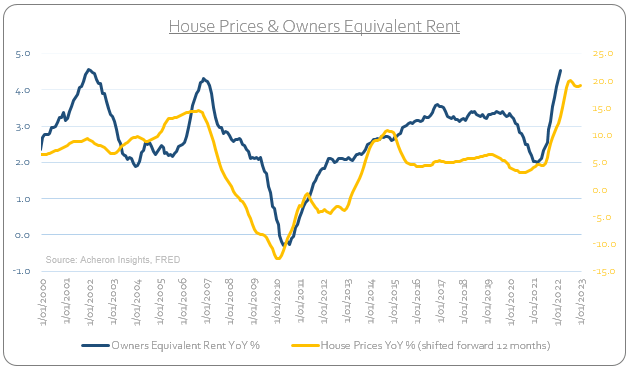
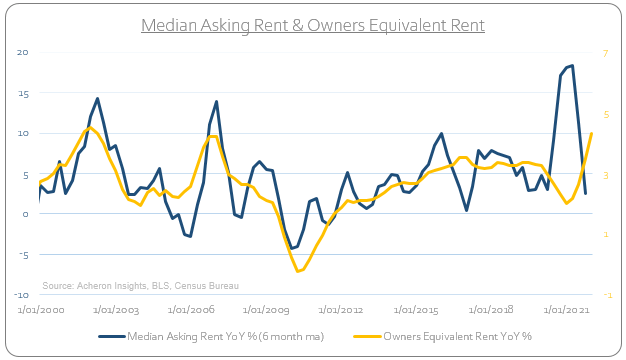
A pull-back in house prices would also be a positive outcome for renters. If we do see rents begin to come down a little or at the very least stabilise for a period of time, this will certainly help alleviate some inflationary pressures in the year ahead, given the Owners’ Equivalent Rent component contributes around 30% of headline CPI.
Median asking rents per the BLS is too suggesting such an outcome, as we can see below.
Structural Tailwinds Remain For The US Housing Market
As the cyclical headwinds for the US housing market are apparent, this is lending credence to many market commentators signaling a bursting of a housing bubble akin to 2008. However, the data does not support this notion, and in fact suggest the structural outlook for US housing is on solid footing.
Indeed, it is important to remember there is a structural undersupply of housing. Despite the pick-up in supply in response to the recent boom in house prices, total housing starts relative to housing stock remains well below the previous cycle highs, whilst the long-term downtrend is clear.
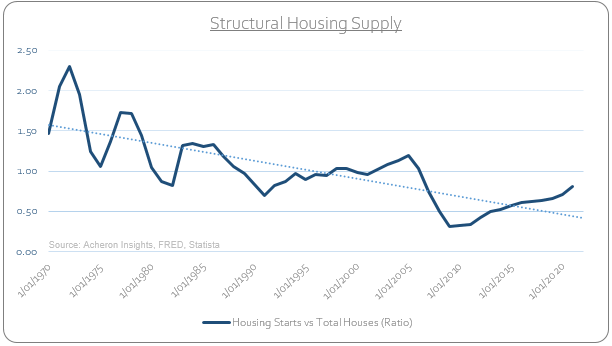
Unlike the housing boom of the early 2000s which was largely fueled by subpar lending standards and credit creation, the tailwind for housing looks to be one driven by an undersupply in housing inventory. This should indeed help to keep a higher floor on house prices relative to previous housing cycles.
The fact that housing supply per working age persons continues to trend lower is indeed supportive of this structural dynamic.
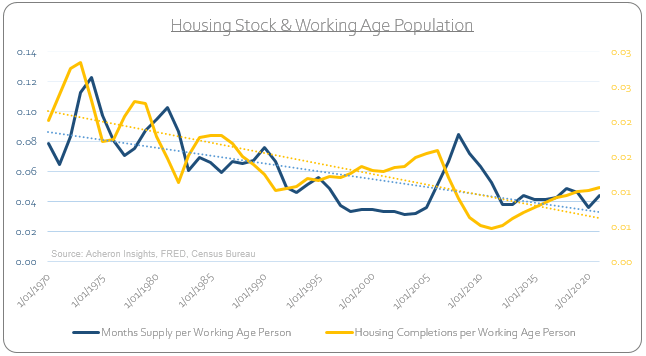
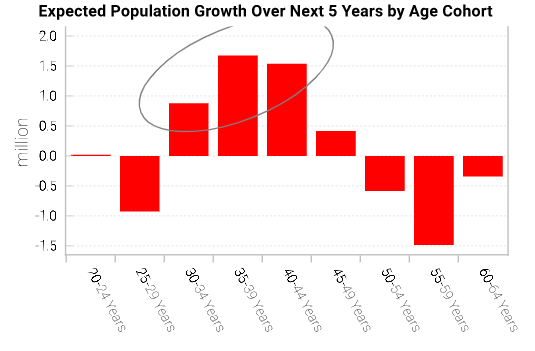
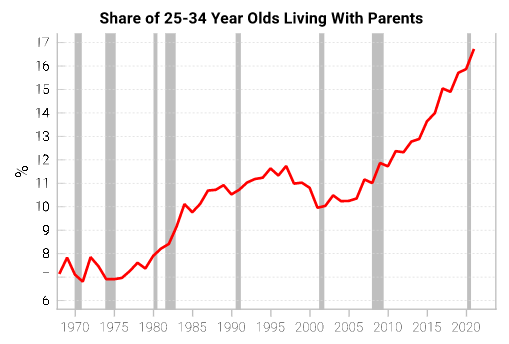
Unless we see a material pick-up in supply over the coming years, this trend in supply relative to the working age population is only likely to worse as the largest expected population growth over the next five years is likely to be for 29-44 years, aka first home buyers. There is a clear demographic tailwind over the coming years as millennials look to enter the housing market.
Source: Variant Perception
Source: Variant Perception
Further supporting these structural tailwinds for housing is the current state of the consumer balance sheet. When analysing the long-term outlook for the housing market, an ever important consideration is the state of consumers and households.
As it stands, household debt service capabilities are in good stead. Mortgage debt service payments as a percentage of disposable income for households remains near their lowest level in over 40 years.
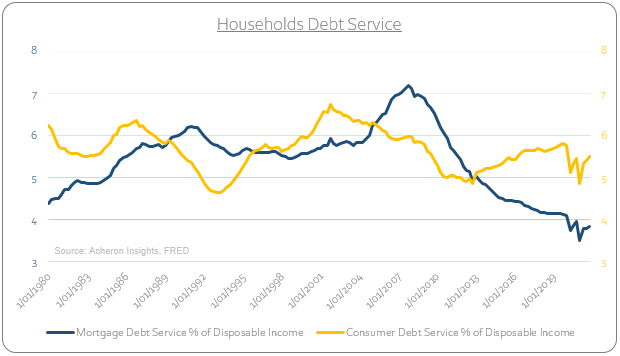
Given that the majority of currently outstanding mortgage debt is fixed and not variable in nature, the fact that inflation resides well above mortgage rates at present is actually a positive for fixed rate mortgage homeowners as the real cost of their repayments are decreasing.
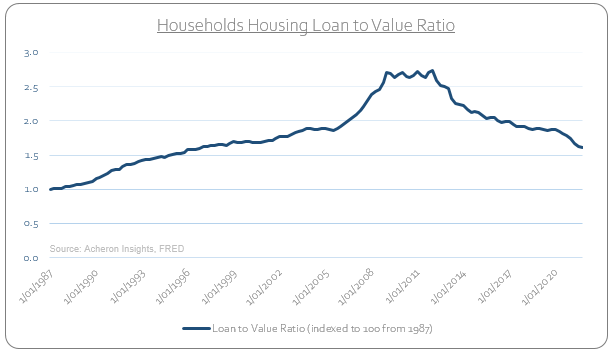
Likewise, compared to the previous housing bubble, the housing loan to value ratio for households has continued to trend lower as households have de-levered post GFC.
Meanwhile, household net worth as a percentage of GDP has climbed to significantly higher levels, for both households as an aggregative and for the bottom 50% of households, although a clear wealth gap remains.
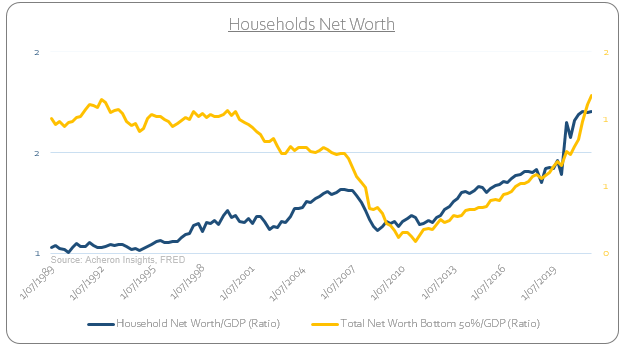
On paper, homeowners are effectively the best ever. These strong consumer balance sheets will help households whether the storm of rising mortgage rates and a cyclical downturn in housing.
Although house prices look set to pull-back in the ensuing months as a result of the significant cyclical headwinds facing the housing market at present, the evidence suggests that the structural bull market in housing remains intact.


